Profiling code
Julia comes with it's own sampling profiler to measure the CPU time spent in functions or the number and size of allocations. There are various packages to visualize these profile traces.
The VS Code extension comes with helpful macros @profview and @profview_allocs to run these profilers, and its own profile viewer. Profiling the example function from the ProfileView.jl readme
function profile_test(n)
    for i = 1:n
        A = randn(100,100,20)
        m = maximum(A)
        Am = mapslices(sum, A; dims=2)
        B = A[:,:,5]
        Bsort = mapslices(sort, B; dims=1)
        b = rand(100)
        C = B.*b
    end
end

# compilation
@profview profile_test(1)
# pure runtime
@profview profile_test(10)
shows a flame graph and inline annotations: 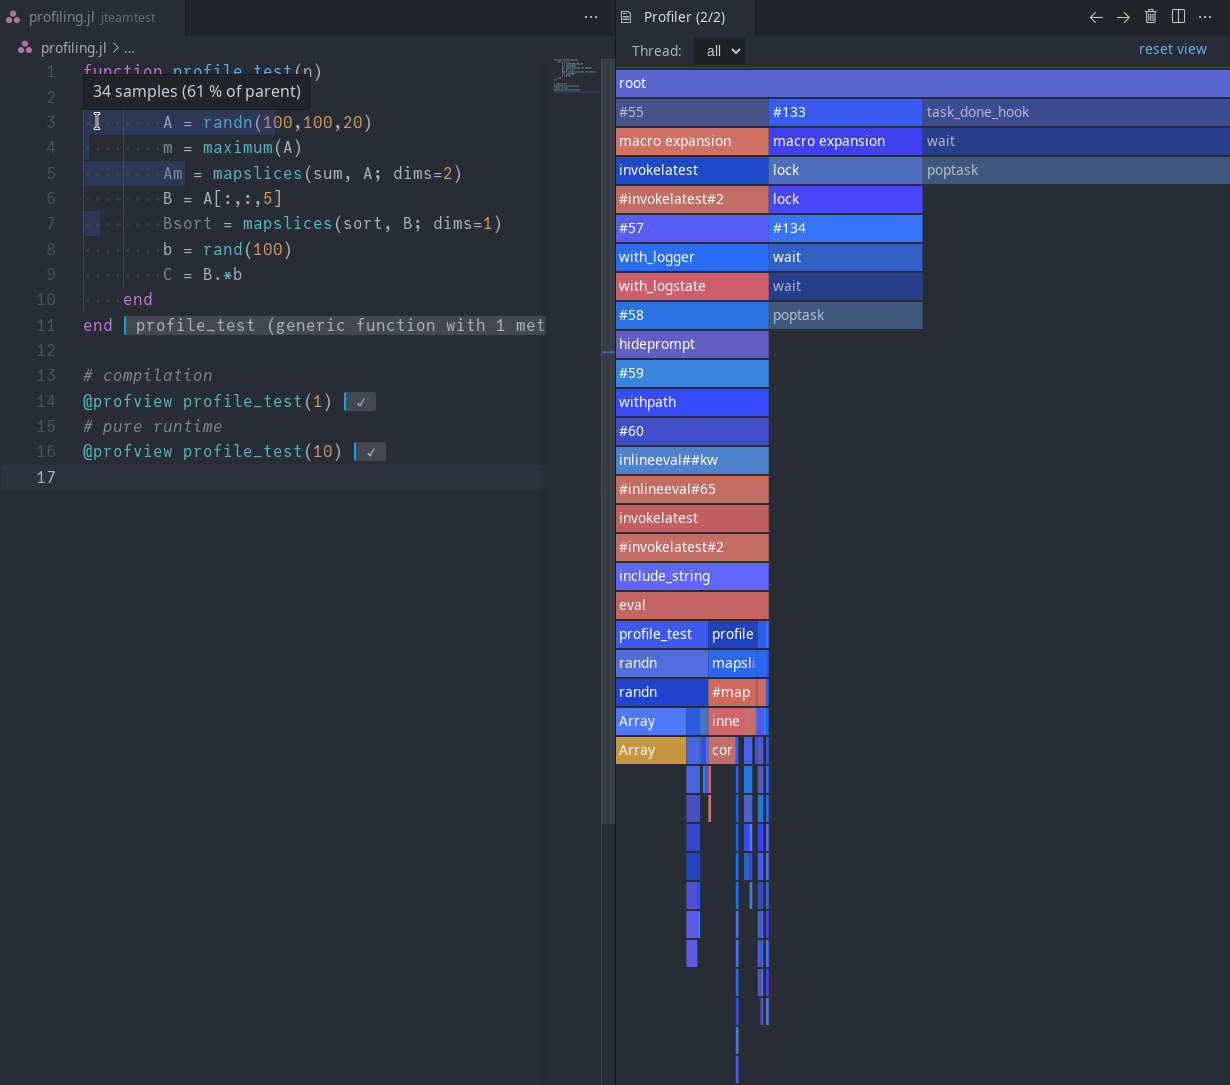
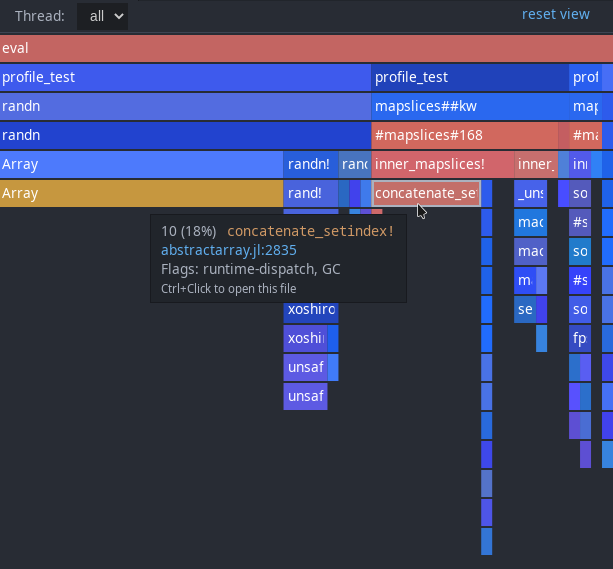
Clicking on any element in the flamegraph zooms in on that element; double clicking on the background (or using the "reset view" button in the upper right) will restore the initial view. Ctrl-Click to open the referenced file.
The tooltip will tell you the number of samples collect in a certain frame as well as the percentage of the top-most displayed frame. There are some heuristics for special flags like garbage collection, dynamic dispatch, and more (these are also color coded).
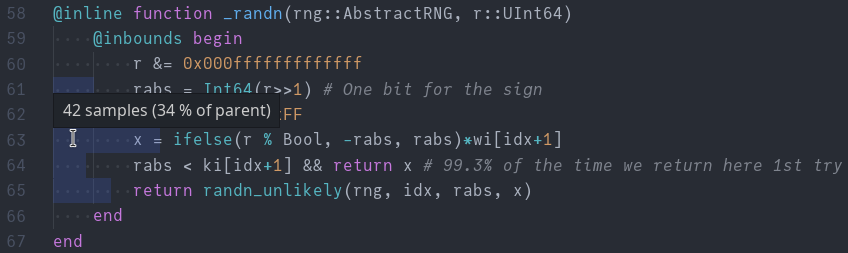
The inline view shows you how much of the parent frame's samples originate on which line (and also the flags, as above, when hovering over the start of the inline annotation):
The allocation profiler works similarly, but shows you the number of allocations or size of allocations instead of the time spent in a function:
@profview_allocs profile_test(10) sample_rate=0.1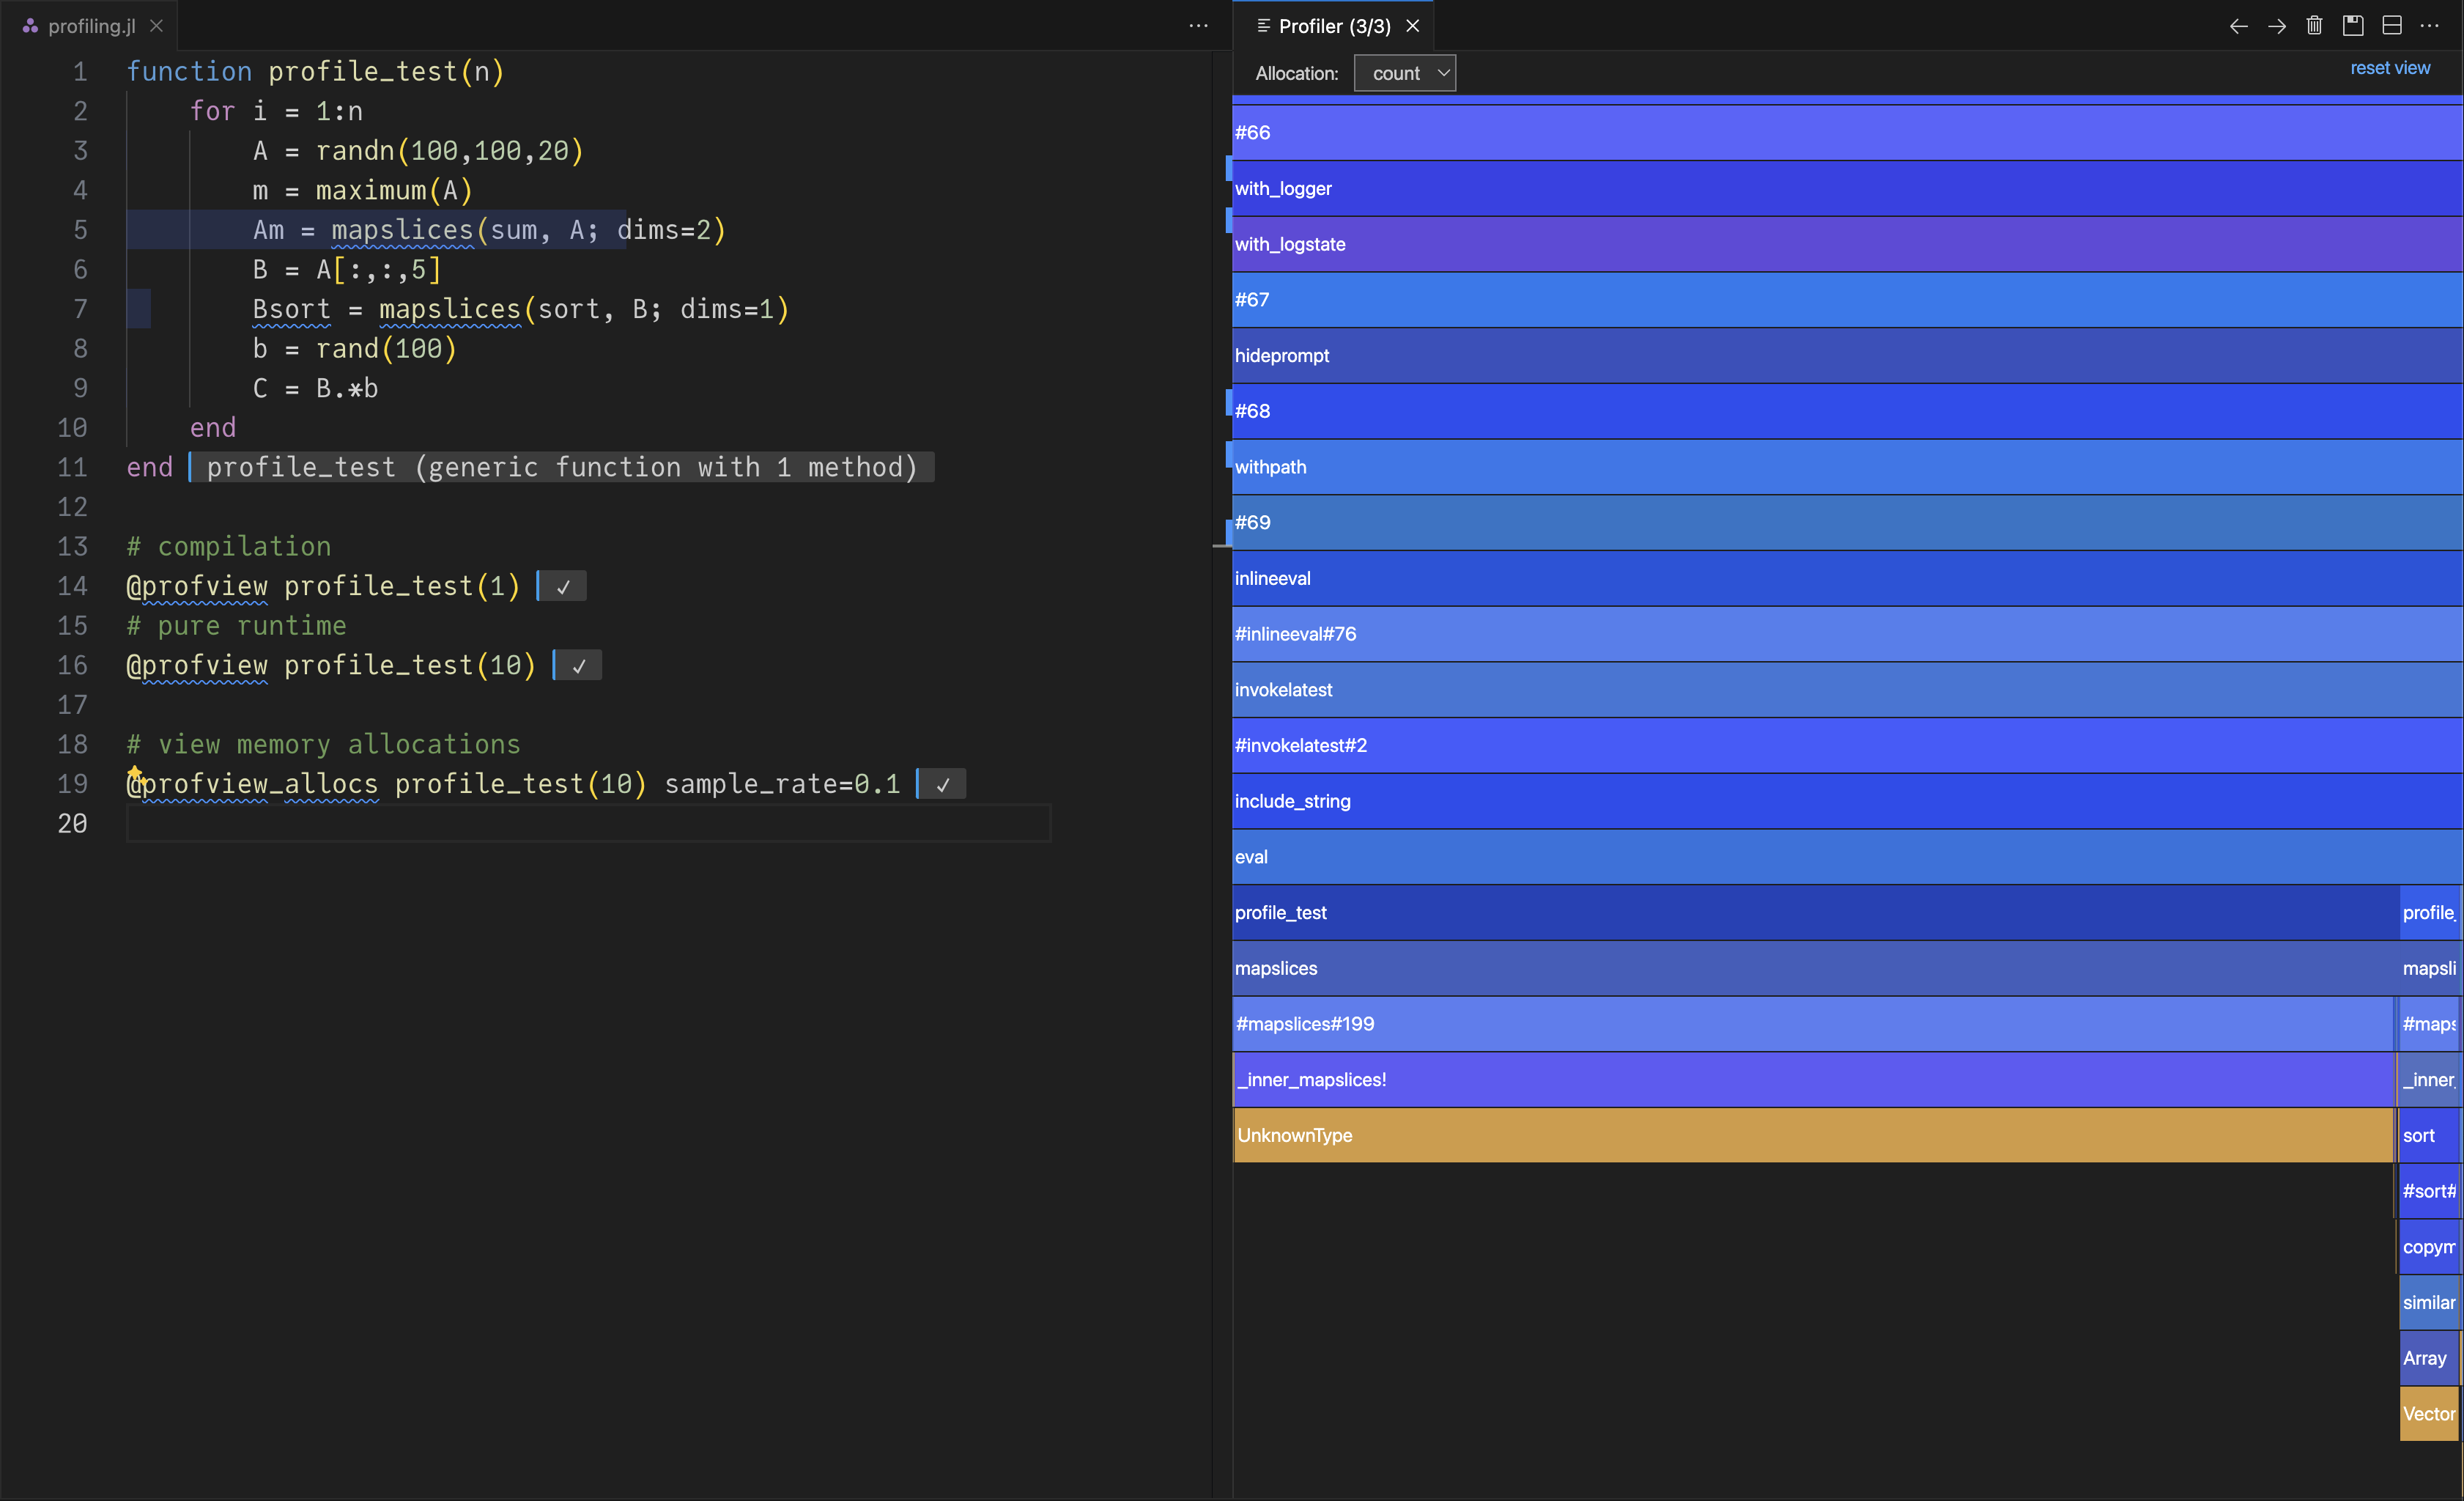
The menu just above the flame graph allows you to toggle between number and size of allocations.
Note that the optional argument sample_rate can be used to adjust the number of samples collected. A sample rate of 1.0 will record everything; 0.0 will record nothing. Use this carefully, as a large value can slow down your code significantly. The default value is 0.0001; if you know that allocations are happening but don't see useful information, increase this value gradually.